Pinpoint
Pinpoint
Role:
Product design, prompt system, and build
Year:
2026 — ongoing
Type:
Figma plugin · Personal project
Built on:
Claude API
Version:
v4.4
Design audits usually end their lives in PDFs and spreadsheets — findings separated from the elements they refer to, applied inconsistently, and forgotten after the presentation. I wanted the audit to happen where the work happens. Pinpoint is a Figma plugin I designed and built on the Claude API: it evaluates a frame against ten UI/UX frameworks, writes each finding directly onto the canvas with an arrow to the element it references, and exports a scored HTML report for stakeholders. Now at v4.4 after months of iteration, it has audited four projects — including a retrospective audit of my own Contabilizei onboarding, which taught me the lesson this case ends with.
Design audits usually end their lives in PDFs and spreadsheets — findings separated from the elements they refer to, applied inconsistently, and forgotten after the presentation. I wanted the audit to happen where the work happens. Pinpoint is a Figma plugin I designed and built on the Claude API: it evaluates a frame against ten UI/UX frameworks, writes each finding directly onto the canvas with an arrow to the element it references, and exports a scored HTML report for stakeholders. Now at v4.4 after months of iteration, it has audited four projects — including a retrospective audit of my own Contabilizei onboarding, which taught me the lesson this case ends with.
The Problem
The Problem
The Problem
Audit output lives outside the file. The loop is broken by default.
Audit output lives outside the file. The loop is broken by default.
Audit output lives outside the file. The loop is broken by default.
Most audit tools produce output that lives outside the file — PDFs, spreadsheets, external reports. The designer reads a finding in one context, then switches back to Figma to hunt for the element it refers to. Manual audits add a second flaw: applying ten frameworks by hand gives different results every time, depending on time, familiarity, and attention.
Most audit tools produce output that lives outside the file — PDFs, spreadsheets, external reports. The designer reads a finding in one context, then switches back to Figma to hunt for the element it refers to. Manual audits add a second flaw: applying ten frameworks by hand gives different results every time, depending on time, familiarity, and attention.
Most audit tools produce output that lives outside the file — PDFs, spreadsheets, external reports. The designer reads a finding in one context, then switches back to Figma to hunt for the element it refers to. Manual audits add a second flaw: applying ten frameworks by hand gives different results every time, depending on time, familiarity, and attention.
Pinpoint started as a structured prompt in Claude that evaluated designs against these frameworks. It worked — but the findings lived in a chat window, far from the canvas.
Pinpoint started as a structured prompt in Claude that evaluated designs against these frameworks. It worked — but the findings lived in a chat window, far from the canvas.
Pinpoint started as a structured prompt in Claude that evaluated designs against these frameworks. It worked — but the findings lived in a chat window, far from the canvas.
What if the audit happened where the work happens?
What if the audit happened where the work happens?
The prompt system became the engine. The plugin became the interface — and Claude specifically, because auditing requires contextual judgment, not just pattern matching.
The prompt system became the engine. The plugin became the interface — and Claude specifically, because auditing requires contextual judgment, not just pattern matching.
The prompt system became the engine. The plugin became the interface — and Claude specifically, because auditing requires contextual judgment, not just pattern matching.
How It Works
How It Works
How It Works
Three steps from selection to findings on the canvas
Three steps from selection to findings on the canvas
Three steps from selection to findings on the canvas


The Output
The Output
The Output
Two artifacts. Two audiences. One workflow.
Two artifacts. Two audiences. One workflow.
Two artifacts. Two audiences. One workflow.

For the designer
Canvas annotations
Each finding is categorized by layer (UI or UX), labeled by severity, and linked to the framework that flagged it — placed directly on the canvas.
text

For the designer
HTML report
The canvas annotations solve the designer's problem. The HTML report solves everyone else's — stakeholders, PMs, and developers who don't work in Figma. A standalone, shareable document with a priority matrix (Quick Wins, Address, Later), an Impact × Effort scatter plot, and the full methodology.
For the designer
Canvas annotations
Each finding is categorized by layer (UI or UX), labeled by severity, and linked to the framework that flagged it — placed directly on the canvas.
text
For everyone outside Figma
HTML report
The canvas annotations solve the designer's problem. The HTML report solves everyone else's — stakeholders, PMs, and developers who don't work in Figma. A standalone, shareable document with a priority matrix (Quick Wins, Address, Later), an Impact × Effort scatter plot, and the full methodology.
For the designer
Canvas annotations
Each finding is categorized by layer (UI or UX), labeled by severity, and linked to the framework that flagged it — placed directly on the canvas.
For everyone outside Figma
HTML report
The canvas annotations solve the designer's problem. The HTML report solves everyone else's — stakeholders, PMs, and developers who don't work in Figma. A standalone, shareable document with a priority matrix (Quick Wins, Address, Later), an Impact × Effort scatter plot, and the full methodology.
The Scoring System
The Scoring System
The Scoring System
1–10. Transparent formula. Documented in every report.
1–10. Transparent formula. Documented in every report.
1–10. Transparent formula. Documented in every report.

Each audit returns three scores on a 1–10 scale: UI, UX, and a combined full score that weights UI at 60% — UI findings are more objectively measurable. The formula weighs findings by severity, normalizes by the number of sections audited, and gives WCAG violations extra weight because they affect real users, not preferences. It is documented in every report, so any stakeholder can see exactly how the number was produced.
For everyone outside Figma
HTML report
Each audit returns three scores on a 1–10 scale: UI, UX, and a combined full score that weights UI at 60% — UI findings are more objectively measurable. The formula weighs findings by severity, normalizes by the number of sections audited, and gives WCAG violations extra weight because they affect real users, not preferences. It is documented in every report, so any stakeholder can see exactly how the number was produced.
For the designer
HTML report
Each audit returns three scores on a 1–10 scale: UI, UX, and a combined full score that weights UI at 60% — UI findings are more objectively measurable. The formula weighs findings by severity, normalizes by the number of sections audited, and gives WCAG violations extra weight because they affect real users, not preferences. It is documented in every report, so any stakeholder can see exactly how the number was produced.
The Frameworks
The Frameworks
The Frameworks
Contextual selection, not blanket application
Contextual selection, not blanket application
Contextual selection, not blanket application

Applying every framework to every project generates noise — a consumer app and an enterprise dashboard fail differently. Pinpoint applies three frameworks to everything (WCAG 2.1, Refactoring UI, Bringhurst's typography) and selects the other seven by context — from Nielsen Norman's heuristics to IBM Carbon's density standards.
Applying every framework to every project generates noise — a consumer app and an enterprise dashboard fail differently. Pinpoint applies three frameworks to everything (WCAG 2.1, Refactoring UI, Bringhurst's typography) and selects the other seven by context — from Nielsen Norman's heuristics to IBM Carbon's density standards.
Applying every framework to every project generates noise — a consumer app and an enterprise dashboard fail differently. Pinpoint applies three frameworks to everything (WCAG 2.1, Refactoring UI, Bringhurst's typography) and selects the other seven by context — from Nielsen Norman's heuristics to IBM Carbon's density standards.
In Practice
In Practice
In Practice
Four projects. One consistent finding: building and auditing are different modes.
Four projects. One consistent finding: building and auditing are different modes.
Four projects. One consistent finding: building and auditing are different modes.
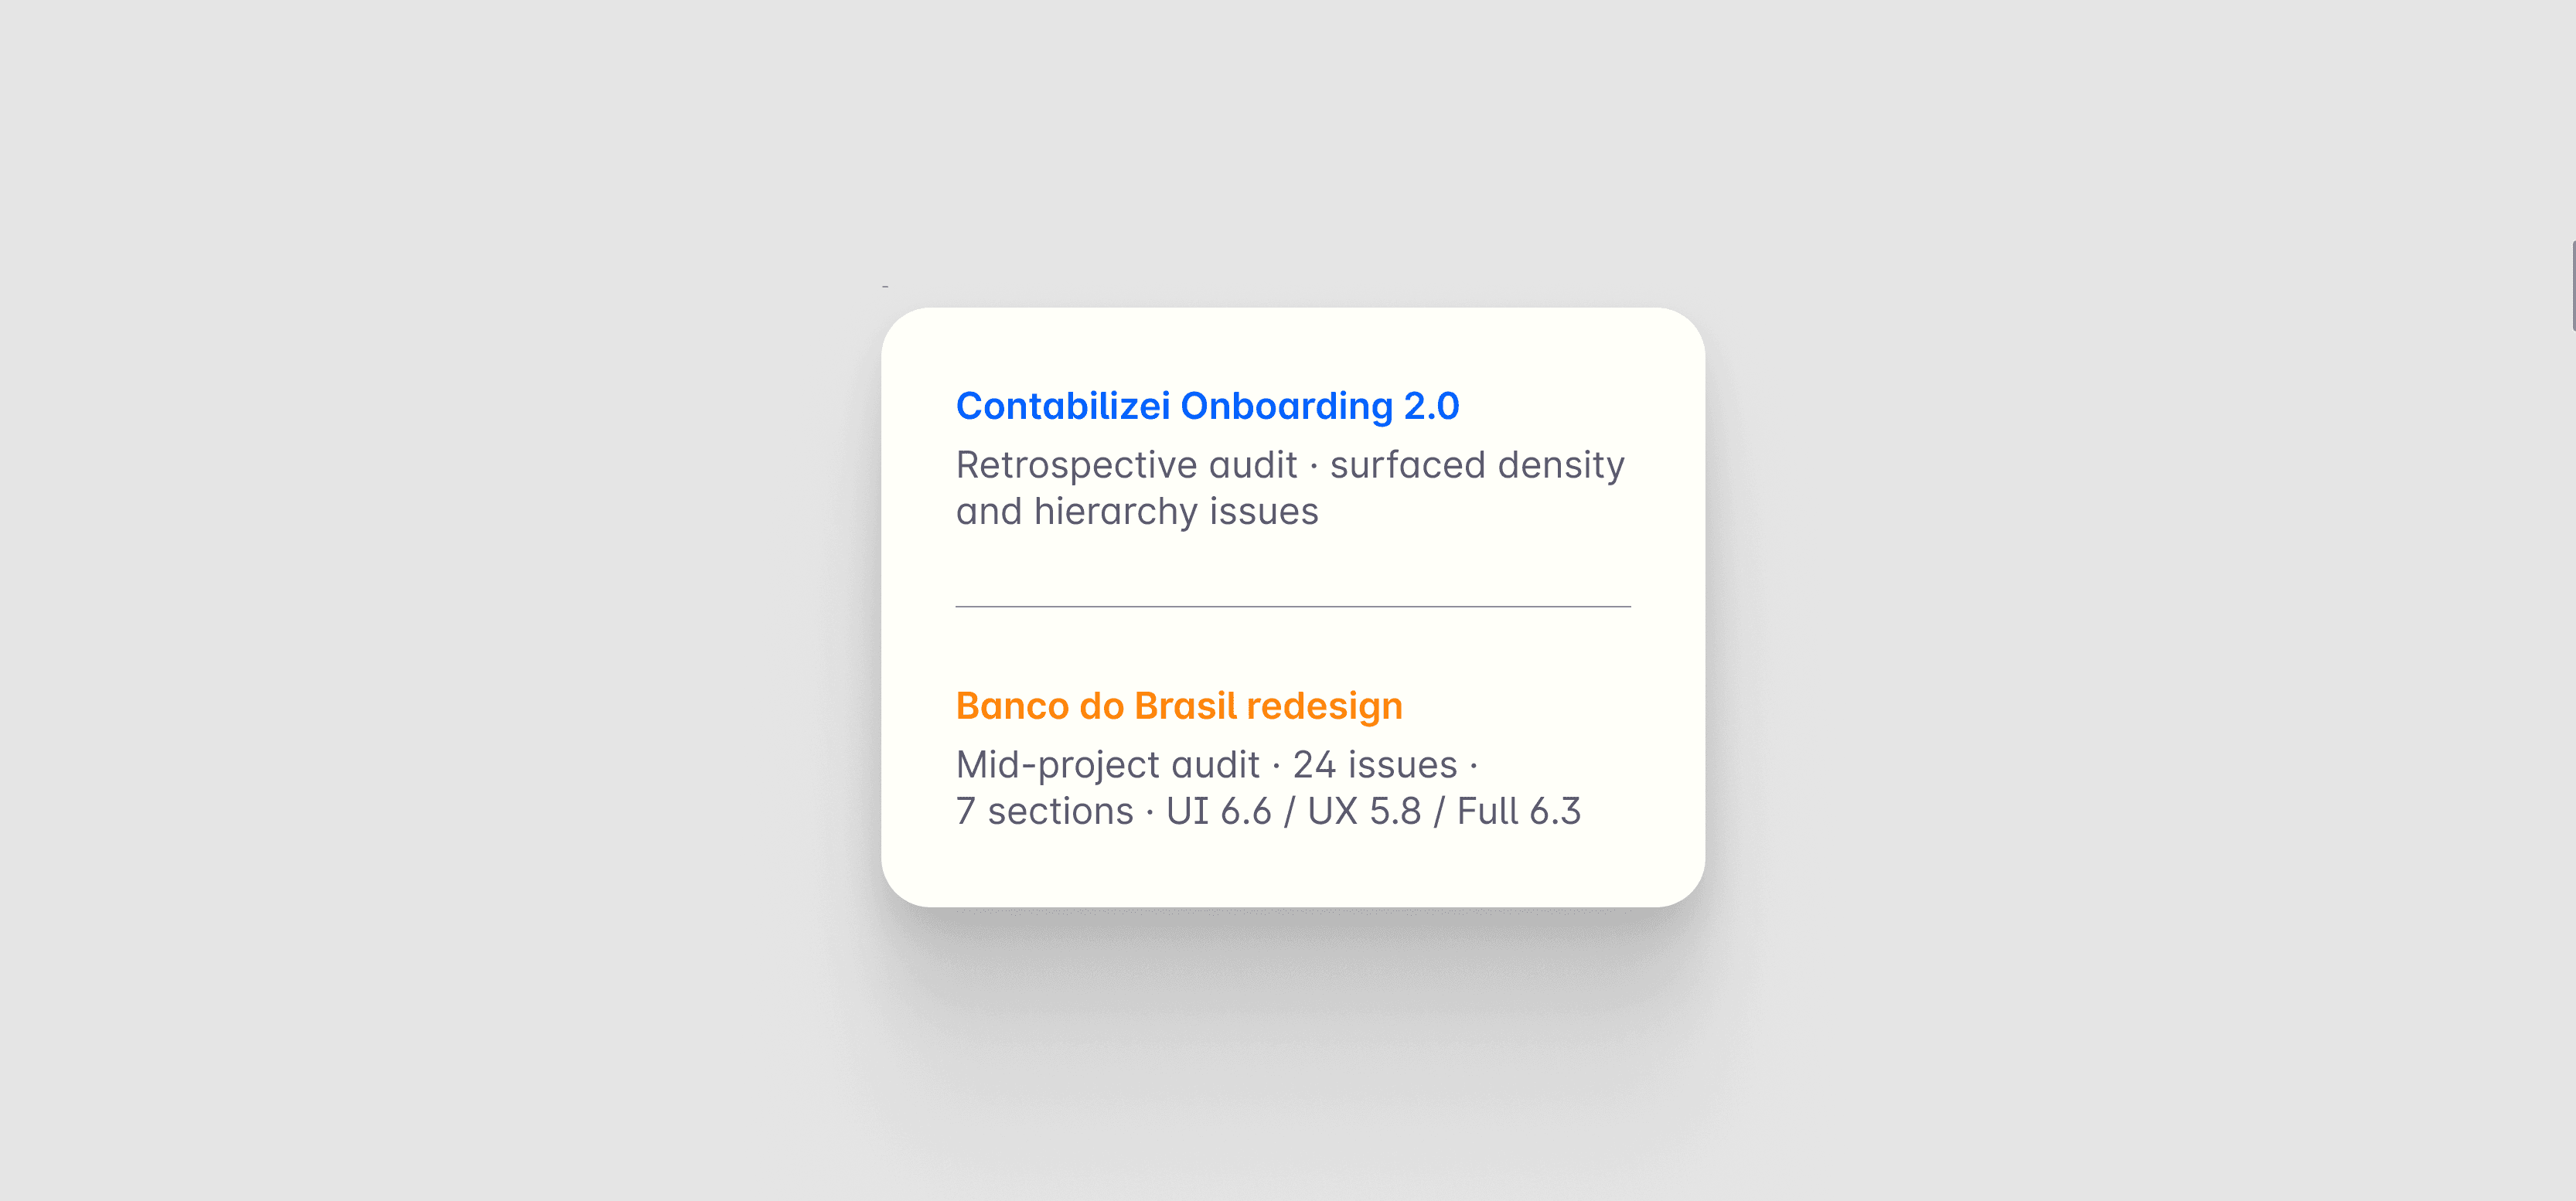
Pinpoint reached v4.4 by being tested on real projects — each version's gaps became the next iteration. Of the four projects audited, the two most instructive were audits of my own work.
A retrospective audit of the Contabilizei Onboarding 2.0 surfaced density and hierarchy issues that were invisible during creation. A mid-flight audit of my Banco do Brasil redesign concept returned 24 findings across 7 sections before the design was finished. Building needs forward momentum; auditing needs critical distance. That gap is the value Pinpoint provides.
Pinpoint reached v4.4 by being tested on real projects — each version's gaps became the next iteration. Of the four projects audited, the two most instructive were audits of my own work.
A retrospective audit of the Contabilizei Onboarding 2.0 surfaced density and hierarchy issues that were invisible during creation. A mid-flight audit of my Banco do Brasil redesign concept returned 24 findings across 7 sections before the design was finished. Building needs forward momentum; auditing needs critical distance. That gap is the value Pinpoint provides.
Pinpoint reached v4.4 by being tested on real projects — each version's gaps became the next iteration. Of the four projects audited, the two most instructive were audits of my own work.
A retrospective audit of the Contabilizei Onboarding 2.0 surfaced density and hierarchy issues that were invisible during creation. A mid-flight audit of my Banco do Brasil redesign concept returned 24 findings across 7 sections before the design was finished. Building needs forward momentum; auditing needs critical distance. That gap is the value Pinpoint provides.
Learnings
Learnings
The most valuable thing Pinpoint taught me was watching my own delivered work fail an audit I designed. Not because the work was careless — but because no one can hold ten frameworks in their head while building. Pinpoint exists to make critical distance cheap enough to use constantly.
The most valuable thing Pinpoint taught me was watching my own delivered work fail an audit I designed. Not because the work was careless — but because no one can hold ten frameworks in their head while building. Pinpoint exists to make critical distance cheap enough to use constantly.
It remains a personal tool, not a product — it requires your own Anthropic API key, and it doesn't yet evaluate interactive behavior or compare a design against a previous audit. That last gap defines the metric I want next: the score delta between audits. Not just finding problems — proving they became fixes.
It remains a personal tool, not a product — it requires your own Anthropic API key, and it doesn't yet evaluate interactive behavior or compare a design against a previous audit. That last gap defines the metric I want next: the score delta between audits. Not just finding problems — proving they became fixes.


